A close analysis of the electoral situation in Venezuela
By Daniel Duquenal
30.10.06 | Poll wars have been going amok recently. Even worse, some are taking those polls very seriously without even trying to connect the dots with the political reality of Venezuela. Thus in a fit of boredom during a rainy Sunday I did pick up my Excel sheet and the results of the CNE and decided to draw an electoral map of Venezuela.
The CNE numbers are the only ones we have for elections. Many think that they are fake for the Recall Election of 2004, and that the following ones are not meaningful in any way because of the raising abstention among other things. Thus to simplify my task I decided to limit myself to a comparison the numbers of the Recall Election of 2004, and those of the “Regionales” (for governors)of that same year, when already many a candidate of the opposition bit the dust because of a large abstention, which became even larger in 2005. The numbers of 2005, I concur, are meaningless for any serious electoral study unless one is interested in measuring the different components of the pro Chavez forces, something which holds no interest for me.
Click on all tables to enlarge.
The potential abstention
The first thing that one should look at is how the abstention will evolve and how it will affect the vote. In this respect the main victim is Rosales, although Chavez also suffers of this phenomenon considering the near 80% abstention rate of 2005.
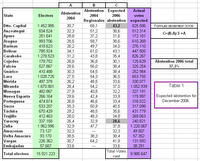
Now the situation between October 2004 and December 2006 has changed. The opposition has  now a candidate, a tam, reasons to vote for and thus the abstention numbers should drop some on its favor. Thus the fist table below which indicates which would be the possible abstention in December. Simply put, I calculated the abstention for next December as the same as for 2004 Recall Election plus one third of the difference between this one and the “regionales” one of October 2004. That is, there is still enough opposition that refuses to vote and some chavistas that prefer not to vote to punish Chavez.
From Table 1 we can see that my calculation, based on the numbers given by the CNE, would yield an overall 37 % abstention which is quite in line with the results obtained since 1998 (the spread would be from 28% to 43% abstention depending on the different states, quite in norm) . Thus we can assume that no more than 10 million votes will be cast in December 2006. How will these votes be spread?
The penalty for Chavez long office tenure
The next thing I looked into was the political penalty that Chavez would pay for being 8 years in office. With a less than stellar administration (over 8 years his results are not positive enough to qualify as a great presidency, as even many chavistas are now routinely hitting the streets to protest) it is expected that at best Chavez will repeat (honestly this time) the score of 2004 when the extraordinary polarization of the country gave what one could say the historical top of Chavez. No half backed train inaugurated a few weeks before December 2006 will allow Chavez to improve this percentile score. Thus the assumption is that Chavez will lose some from 2004, but how much?
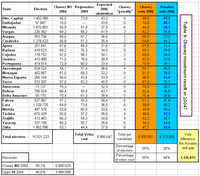
Again we have only the CNE numbers. In Table 2 I have calculated the following things, based on percentage of votes obtained. Looking at actual vote numbers is misleading in that case since abstention screws up everything and many do contest the actual numbers. Thus there are three columns where I have listed the interesting observations:
1) Column A. Decrease between the score of Chavez in August 2004 and what his candidate for governor obtained. This reflects not only regional problems that could come back to hurt Chavez, but also reflects the relative strength on his hold to office in these areas. When the percentile decrease is more than 5%, then there is a problem at the local level which could in two years bring vote loss to Chavez. Such states have their results marked with bold orange.
2) Column B. Increase in abstention between 8/2006 and 10/2006. This is what the opposition mostly lost and where it could recoup some. However since there might have been a certain chavista abstention now the boss was back in charge safely after August 15. I decided arbitrarily that abstention increase was due mostly to opposition disenchantment where the variation is more than 25%. Those states are indicated in red letter. And I have assumed that the opposition will recover more from that abstention than Chavez.
3) Column C. Now I imagined the ratio between the increase in abstention and what Chavez candidates did gain or not. That is, if all the abstention is due to the opposition withdrawing, the pro Chavez candidates for the governor house should increase its percentage by a related number. We observe in the column C of the table that it is not the case and that the ration is often way outside a -3 to +2 interval, which one would consider an anomaly. Thus where the ration is above 2 (bold blue) it is quite likely that the opposition could show a strong come back and when the ration drops below -3 (bold pink) then there is a local leadership problem that could come and hurt Chavez chances this time around. By setting this -3 to +2 or “normal” electoral behavior I introduce a slight bias in favor of Chavez.
Obviously from looking at columns A, B, and C, there are some strange anomalies in the elector behavior. To interpret this, the first thing was to ignore the bold pink numbers, those reflecting a high dissociation between Chavez and his appointed governor. After all, one can argue that elector loyalty to Chavez is bigger and thus it will forgive Chavez for the bad local system, and at worst increase the abstention ranks on December 2006.
Once this simplification done (but not ignored) I divided the states in 4 groups, depending how the index in A, B, and C played. In green, the states which are safe for Chavez. That is, I consider that these states are not likely to change much and Chavez should recover his 2004 result. In the other three groups I have assumed that Chavez will pay a penalty and that penalty will be either 6%, 4% or 2% loss in percentile points from the 2004 result. The test used are listed on the right bottom corner of the table. These tests are not completely applicable as I consider that Barinas, Zulia, Carabobo and Yaracuy are going through exceptional situations and I forced them into one or the other category.
To explain these tests application I will chose the example of the criteria to makes Chavez lose 6%. These states are those where the opposition have abstained the most and where the Chavez candidate failed the most to benefit from that abstention. For example in the case of Caracas the abstention more than doubled from August to October 2004 (31% to 68%), and yet Bernal failed to increase by even 20% his percentile share of the vote. Clearly, Caracas, thus marked in lilac, is a prime ground for the opposition to gain a significant amount of votes, perhaps even slash a 6% in the Chavez result of 2004 considering how disastrous the quality of life Caracas has become, in particular since 2004. note again: I am discussing percentile points, not actual votes.
From table 2 one can thus see that Chavez has some local problems. My speculation is just that, a speculation on how negatively Chavez could be affected, and willingly I have tried to give Chavez as much edge as possible, considering my knowledge of local politics, the voting historical pattern, etc… (For example Aragua is a very anomalous state yet it has been ruled from the left for so long that I decided to leave it as almost safe for Chavez, just taking away 2%; the abnormality in Aragua could well be due to possible tampering of votes in 2004, but I swore not to go into this today).
The high water mark for Chavez?
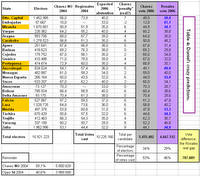
Now that I have evaluated a percentile loss from 0 to 6 % for Chavez, and the possible abstention rate, I just needed to combine the data in Table 3. For this table I have listed the possible abstention of 2006 from table 1, the penalty of 0 to 6% from table 2 which results in the expected vote, percentile, state by state (orange column). For Rosales I assumed that other candidates will get 1% and thus Rosales would get 99 minus Chavez vote (blue column). Then using the wonders of Excel formulas I calculated, based on the CNE electoral roll numbers to date and the percentile vote to be obtained what are the number of votes that each one would get, today, if elections were held.
Now, of course, I am assuming that no other candidate will show any strength, and that whatever does not vote for Chavez will vote for Rosales without discussing much whether the abstention problem within the opposition is indeed solved. But the interest of this table 3 is that I believe it shows which is the maximum that Chavez can get today, and this is 5 and a half million, even less than in 2004. I really do think that chavismo is affected by an 8 years tiresome and enervating performance and his has the great risk that people might not vote for Rosales but might stay home and not go out and vote for Chavez. This is how that table must be read, the Rosales vote can be whatever it is, the Chavez vote is stuck at 5.5 million.
Now, it still carries information for Rosales: the gap today is at least 1,1 million and he must recover that in the last month of campaign. A daunting but not impossible task. The good news for Rosales is that it is unlikely that Chaevz will progress much during the last month.
Note: in this table I decided to regroup the states in regional order, since their relative strength of each candidate can be observed by group of states rather than by individual states. Also I indicated in bold blue the states that Rosales should be winning no matter what, again, if the CNE counts the vote as expected.
Daniel’s penalty
Finally, since I must have some fun as I do this, I decided to calculate my own penalty, a definitely subjective proposal, getting table 4. I simply took table 3 and arbitrarily changed the abstention rate in some states and decided to increase by gut feeling, the vote loss of Chavez. The result is better for Rosales but I still have Chavez ahead, albeit closer to Rosales (0,8 million instead of 1,2). What I mean with this exercise is that even if polls in Rosales camp are better than what is coming out from suspicious pollsters, the game is not over yet.
However I also added something: the states highlighted in orange are states where an additional 2 % shift toward Rosales could bring him 200 000 votes and narrow the gap to 400 K! It is thus possible, even giving a slight bias to Chavez, that Rosales can win. However one thing is certain, right now if Rosales win it will not be by much.
Note: this is not my final prediction. I will update that table a few days before December 3 and then will take bets. If anyone wants me to send them my template for this particular table, write me and I will oblige.
Conclusions
Conclusion 1: the 10 million votes slogan for Chavez is dead. At most around 10 million people will bother to vote on election day, and even if we assume the polls most favorable to Chavez, at least 30% will not vote for him. In other words Chavez will be lucky if he even gets close to 7 million votes if all goes his way until December, no matter that Ameliach already conceded it would not pass the 8 million mark.
Conclusion 2: there are very anomalous shifts in voting patterns between states. The way in which these shifts happened allow to suspect that any normalization of the voting pattern is more likely to favor Rosales than Chavez. That is, it will be very difficult for Chavez to get back his 2004 60% high. Unless of course the CNE helps along as it does already by being shamelessly lenient on all the campaign abuses committed by chavismo.
Conclusion 3: Chavismo has a top vote, a “plafond”, which should not be more than 6 million if we consider the electoral history of the elections since 1998. It is very, very unlikely that chavismo will pass that 6 million mark. And this assuming that the past CNE results are real results. If we think that something is amiss (look at Aragua for example, something that cannot be explained with normal and historical voting patterns) then Chavez might not even reach 5 million.
Conclusion 4: The best scenario so far is Chavez winning with 55% of votes cast but only 35% of the electorate. This would be a good victory if we were in a democratic regime where no major changes are planned. However this result is woefully insufficient for the massive socialization plans and constitutional changes that Chavez has announced. An opposition renewed with 40% or more of the vote will not simplify the political life of the country in the way that Chavez hopes. In other words, far from bringing peace to Venezuela, the result of December 3 might in fact bring back instability for a long, long time. Chavez set himself the trap in which he is falling. By aiming for 10 million, and then 8 and then getting 6 at most, he will turn his victory into a defeat, a self inflicted political wound which will make him a lameduck president from day one of his new term.
There is one month left before the election. We will see.
--- --- --- --- --- --- --- ---
Note: since this is a rather complicated work, not to be found around (though I am sure that political staffs have way more sophisticated models that they are not releasing for obvious reasons) I will welcome any observation as to errors that I have made, better ways to create representative or suggestive indexes, better way to present the data and its projections.
send this article to a friend >>
